A single log entry rarely explains a network event on its own. Netyum One Analyzer provides a central view of firewall and syslog data so that events can be reviewed alongside relevant traffic information.
The Netyum One approach
Traffic, application, policy, VPN, web and DNS records can be filtered to support an investigation. Reporting and archive workflows help the operations team maintain a regular review process.
Planning and deployment
Source devices, timestamps, data flow and retention scope are considered during setup. Checks using sample events help confirm that records are associated with the correct source and location.
One console for traffic, policy, risk and investigation.
Correlate high-volume firewall and syslog events by source, destination, user, device, rule, application, protocol, zone, country and time range without switching between disconnected tools.
Investigate every layer of network activity from one operational view.
01
ALLOW / BLOCK trend
Compare allowed and blocked traffic over time, identify spikes and monitor enforcement behavior.
02
Rule and policy effectiveness
See hit counts, action distribution and the policies generating the most traffic or blocks.
03
NAT and proxy intelligence
Analyze translated addresses, proxy activity, source-to-destination mappings and usage patterns.
04
Zone and interface flows
Understand traffic direction and volume across firewall zones, interfaces and network segments.
05
Flow analysis
Inspect top flows by source, destination, protocol, port, bytes, sessions and action.
06
Geographic distribution
Visualize source and destination countries on an interactive map with volume and block ratios.
07
Top talkers
Identify the highest-volume source and destination IPs, users and devices.
08
Applications, categories and risk
Reveal application usage, category distribution and high-risk activity from firewall telemetry.
09
VPN insights
Track VPN connections, users, endpoints, durations and operational patterns.
10
Web, URL and domain analytics
Analyze visited domains, URLs, categories, actions and web traffic behavior.
11
DNS insights
Explore DNS queries, domains, clients, responses and suspicious lookup patterns.
12
Powerful search and exports
Filter by time, IP, user, action, protocol, device and more; export operational datasets for reporting.
FROM EVENT TO INSIGHT
A focused investigation flow for high-volume telemetry.
01
Collect
Receive firewall, syslog and network security events from supported infrastructure.
02
Normalize
Map vendor-specific fields into consistent traffic, policy, identity and application dimensions.
03
Analyze
Use dedicated modules, filters, charts and tables to isolate meaningful behavior.
04
Act
Export evidence, refine policy and accelerate operational or compliance workflows.
VISUAL INVESTIGATION
Geography, top talkers and risk in one analyst workspace.
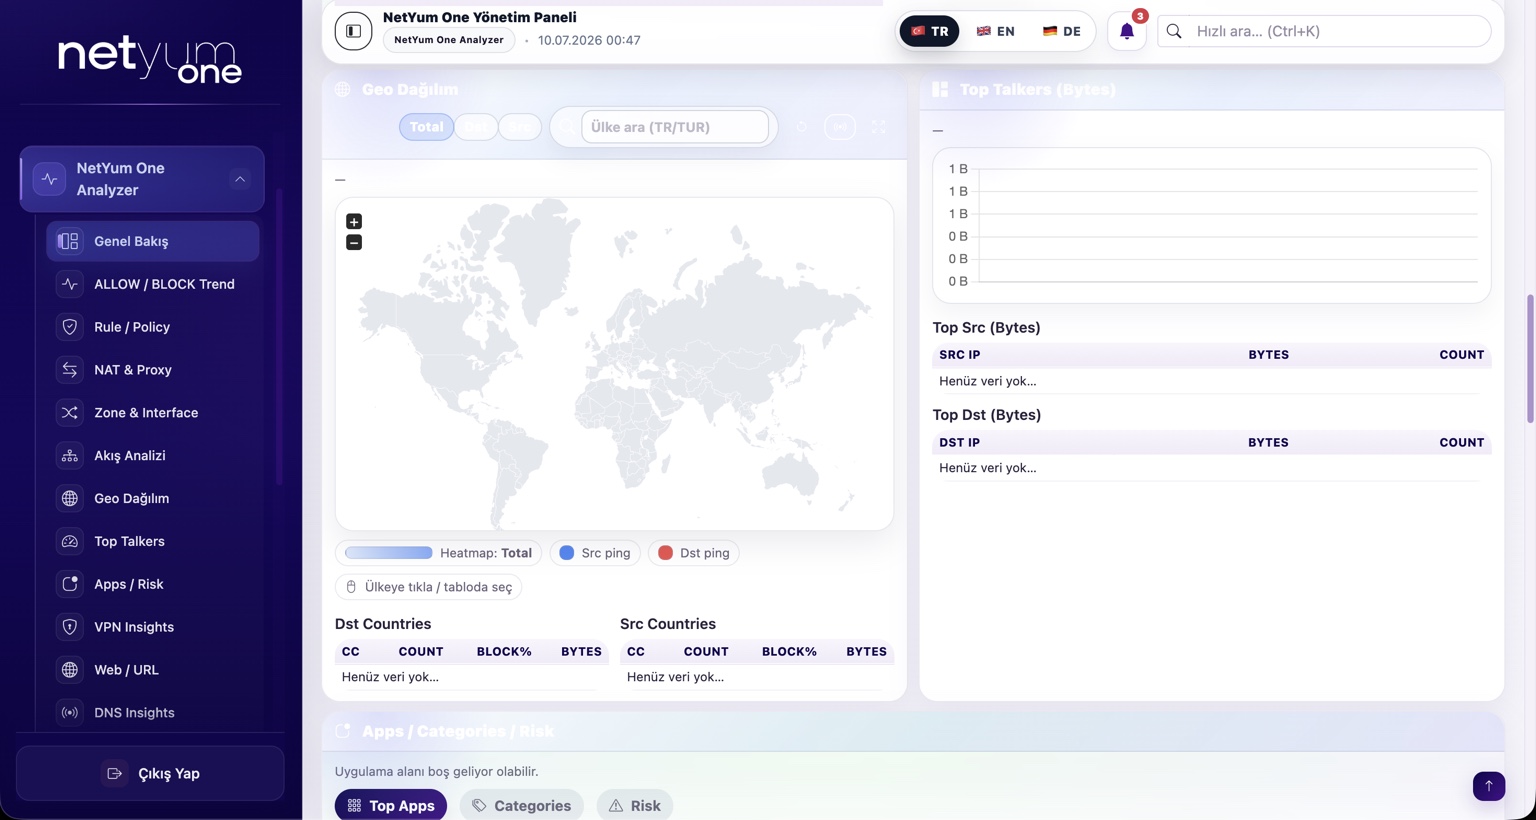
The Analyzer dashboard combines interactive maps, traffic charts, top source and destination tables, application risk, VPN activity, web intelligence and DNS behavior.
✓Geographic distribution
✓Top talkers
✓Applications, categories and risk
✓VPN insights
✓Web, URL and domain analytics
✓DNS insights
BUILT FOR COMPLEX NETWORKS
Analytics for organizations that need continuous traffic intelligence.
EnterprisesHotels & HospitalityHealthcareEducation & CampusesManaged Service ProvidersMulti-site BusinessesPublic InstitutionsSecurity Operations Teams
OPERATIONAL VALUE
Reduce investigation time while increasing network visibility.
01
Accelerate investigations
Move from raw events to filtered evidence with dedicated analysis modules.
02
Improve policy quality
Use hit and action data to validate, tune and simplify firewall rules.
03
Expose risk sooner
Bring applications, web, VPN, DNS and geographic signals together for faster context.
04
Support reporting
Preserve searchable, exportable telemetry for operations and compliance-oriented workflows.
NETYUM ONE ANALYZER
See Netyum One Analyzer with your own network data.
We can map your firewall, syslog, retention and reporting requirements into a practical analytics deployment.